

Quick Summary: Market Snapshot
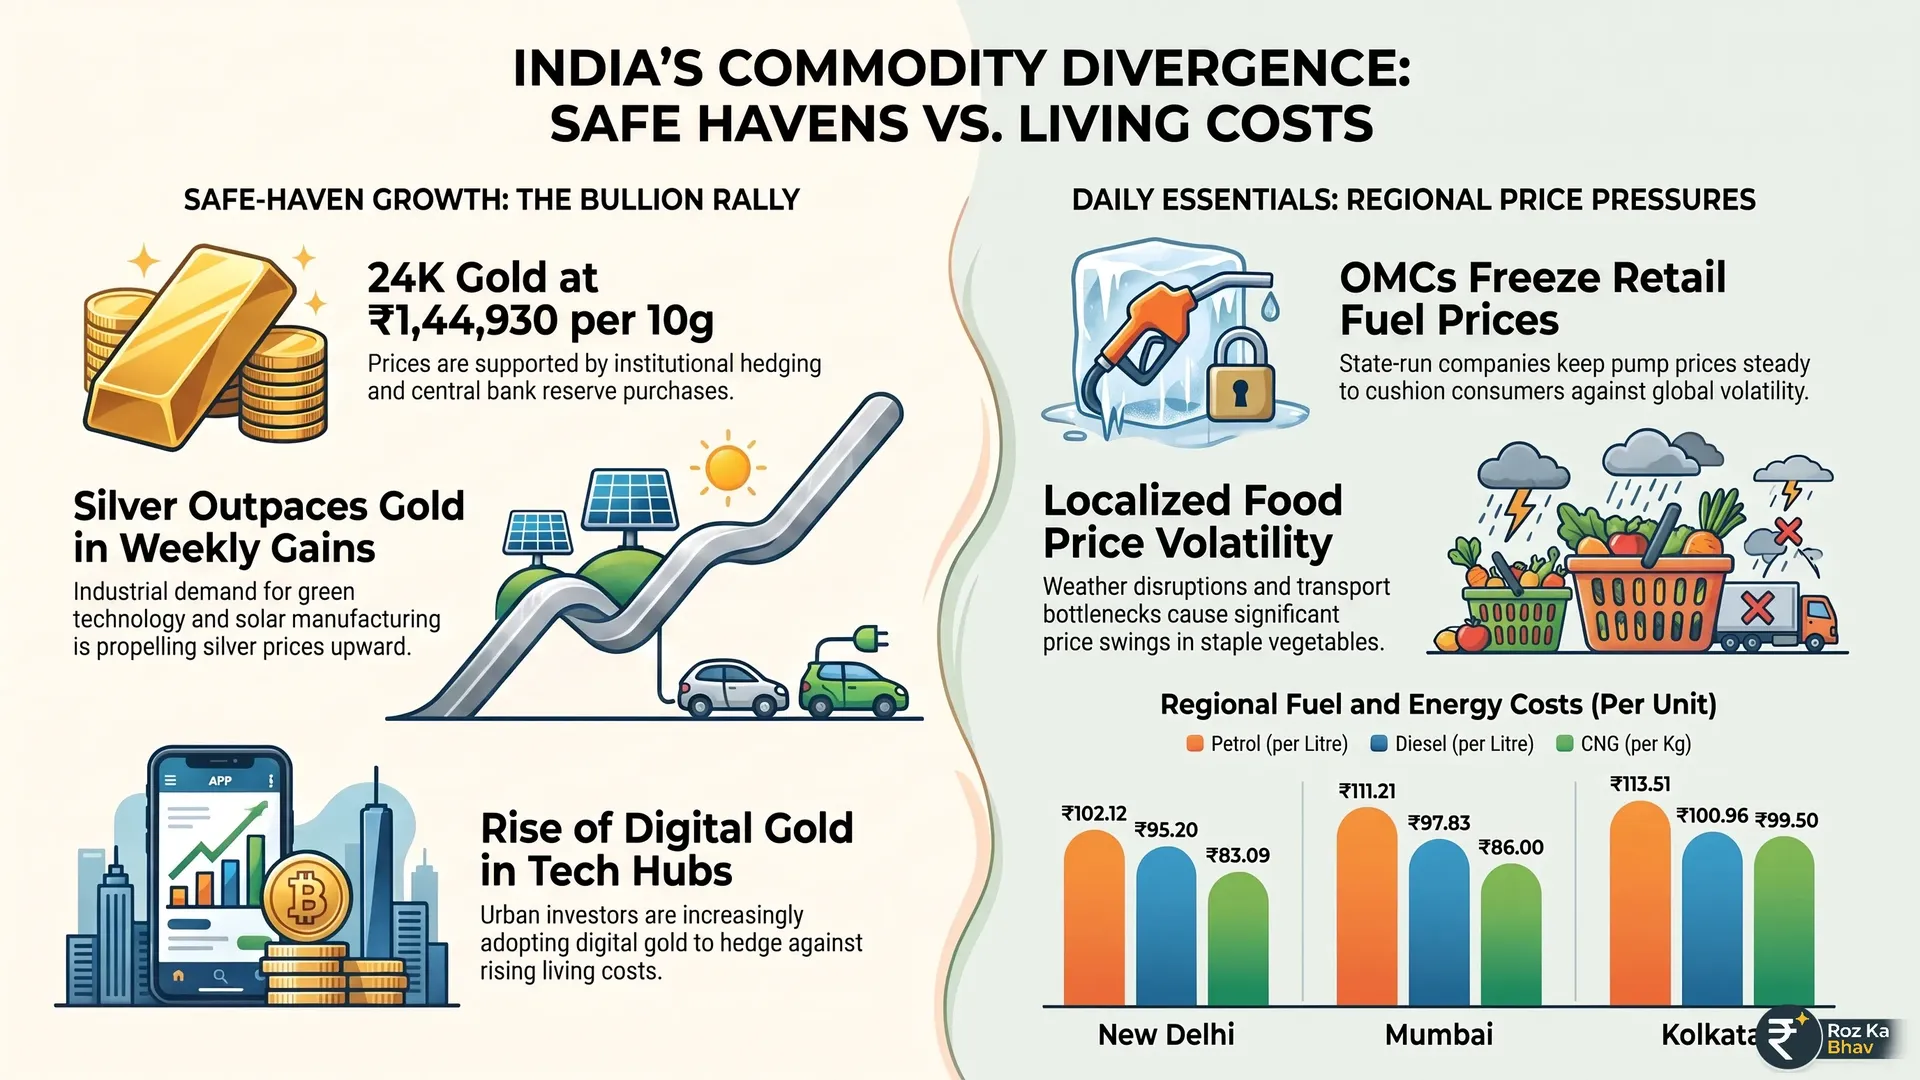
Today’s Indian commodity market exhibits distinct sector divergences: bullion markets hold strong weekly gains with 24K gold trading at ₹1,44,930 per 10 grams and silver crossing ₹2,40,000 per kilogram amid robust safe-haven demand; retail fuel prices remain heavily anchored by state-administered pricing; while kitchen essentials like seasonal vegetables and dairy face localized supply chain cost pressures.
Indian Commodity Report: Bullion Holds Highs, Fuel Stays Anchored, and Kitchen Budgets Feel the Pinch
As the Indian economy navigates the mid-point of 2026, market participants are closely examining shifting macroeconomic indicators. What began as a volatile week for global risk assets has crystallized into steady defensive positioning across domestic markets. From bullion desks in Zaveri Bazaar to retail vegetable vendors in local mandis, price dynamics are dictated by a blend of international geopolitical sentiment, currency fluctuations against the US Dollar, domestic supply constraints, and revised logistics surcharges. What this means for your wallet is a balancing act between appreciating investment assets and sticky everyday consumer expenditures.
Bullion Market: Gold and Silver Analysis
The precious metals landscape in India has displayed remarkable resilience. Following a volatile early-month correction, both gold and silver staged a powerful recovery, capitalizing on safe-haven buying as global macroeconomic uncertainty persists. Market analysts at Dalal Street note that institutional flows into bullion have strengthened, supported by a softer dollar index, central bank reserve acquisitions, and shifting expectations around international central bank monetary policies.
Retail buyers returning to the market are encountering elevated baseline prices. While the Multi Commodity Exchange (MCX) observes its standard weekend shutdown, spot physical markets reflect firm sentiment. Silver has notably outperformed gold on a percentage-basis weekly scale, drawing aggressive interest from industrial consumers and retail investors alike who view the white metal as an aggressive play on green technology transitions, solar manufacturing expansions, and electronic component manufacturing.
Note: Data based on 2026-07-26.
| Metal & Purity | Rate per 10 grams (INR) | Rate per 1 kg (INR) | Weekly Trend |
|---|---|---|---|
| Gold (24K – 99.9%) | ₹1,44,930 | ₹1,44,93,000 (per 100g: ₹14,49,300) | Bullish (+0.42%) |
| Gold (22K – 91.6%) | ₹1,32,850 | ₹1,32,85,000 | Bullish (+0.42%) |
| Gold (18K – 75.0%) | ₹1,08,700 | ₹1,08,70,000 | Steady |
| Silver (99.9% Purity) | ₹2,400 (per 10g) | ₹2,40,000 | Strong Outperformer |
Energy Watch: Petrol, Diesel, and CNG Trends
In the energy sector, domestic retail prices for transportation fuels have maintained a prolonged phase of administrative stability. Despite lingering volatility in international crude benchmarks like Brent, hovering near elevated thresholds due to supply-side management by major producers, State-Run Oil Marketing Companies (OMCs) have kept retail pump prices largely unchanged across key metropolitan hubs.
This prolonged freeze cushions retail inflation figures, shielding everyday commuters from wild global price swings. However, structural divergence remains wide across state borders due to varying Value Added Tax (VAT) structures, local municipal surcharges, and freight charges. Commercial fleet operators continue to optimize logistics around regional price variances, particularly as alternative green fuels like Compressed Natural Gas (CNG) gain incremental traction in urban centers and interstate transport corridors.
Note: Data based on 2026-07-26.
| City | Petrol (per Litre) | Diesel (per Litre) | CNG (per kg – approx.) |
|---|---|---|---|
| New Delhi | ₹102.12 | ₹95.20 | ₹83.09 |
| Mumbai | ₹111.21 | ₹97.83 | ₹86.00 |
| Kolkata | ₹113.51 | ₹100.96 | ₹99.50 |
| Chennai | ₹107.76 | ₹99.55 | ₹97.00 |
| Bengaluru | ₹110.44 | ₹98.39 | ₹97.00 |
Kitchen Essentials: Vegetable and Dairy Price Dynamics
For the average household, price volatility is felt most acutely in the kitchen. Agricultural mandis report a mixed bag for vegetable baskets. While seasonal tuber crops remain reasonably priced, sudden localized weather disruptions in key producing agrarian belts have caused intermittent spikes in staple greens and select bulb items. Supply chain intermediaries note that transportation bottlenecks and unseasonable rainfall patterns continue to add a frictional cost before produce hits urban retail shelves.
Meanwhile, the dairy segment exhibits structural firmness. Cooperatives and private dairy players have maintained steady packaged milk pricing, though high fodder, cattle feed tariffs, and operational cooling costs keep input pressures high for dairy farmers. Consumers are increasingly transitioning toward organized packet milk formats and subscription-based doorstep delivery apps, altering traditional procurement habits.
Note: Data based on 2026-07-26.
| Commodity Item | Average Retail Price (INR) | Market Tendency |
|---|---|---|
| Tomatoes (1 kg) | ₹40 – ₹60 | Volatile due to transport shifts |
| Onions (1 kg) | ₹35 – ₹50 | Stable to Firm |
| Potatoes (1 kg) | ₹25 – ₹35 | Stable |
| Packaged Milk (1 Litre Full Cream) | ₹66 – ₹72 | Firm / High Input Cost |
| Edible Sunflower Oil (1 Litre) | ₹120 – ₹140 | Range-bound |
City-Specific Market Intelligence
A closer look at regional markets reveals unique micro-economic trends shaping consumer behavior across India’s financial hubs:
1. Mumbai (The Financial Capital)
Mumbai’s retail markets are absorbing high operational overheads; with petrol firmly at ₹111.21 per litre, local transport costs remain sticky. Bullion demand in Zaveri Bazaar stays resilient as HNIs hedge against global equity corrections, while suburban vegetable vendors report steady footfalls despite tight margins and elevated real estate rentals.
2. New Delhi & National Capital Region (NCR)
As the administrative heart of the country, Delhi benefits from comparatively lower fuel tax structures; with petrol at ₹102.12 per litre, CNG serves as a primary relief valve for commercial transit fleets. Azadpur Mandi supplies are currently adequate, keeping Vegetable Price spikes localized and short-lived across suburban satellite hubs like Noida and Gurugram.
3. Bengaluru (The Tech Hub)
Bengaluru’s urban retail inflation reflects strong demand pull; high real estate overheads feed directly into local grocery and supermarket pricing. Tech professionals driving retail investment are heavily active in digital gold platforms, Sovereign Gold Bond secondary markets, and mutual fund systematic investment plans (SIPs) to outpace local cost-of-living adjustments.
Frequently Asked Questions (FAQs)
1. Why are gold and silver prices surging in the Indian market?
Prices are climbing due to a combination of safe-haven buying driven by global geopolitical uncertainties, a weaker US dollar index, institutional hedging, and strong domestic accumulation by both retail and institutional buyers.
2. Are retail fuel prices revised daily in India?
Yes, state-run oil marketing companies operate under a dynamic pricing mechanism intended to adjust rates daily; however, retail prices frequently experience extended periods of administrative stabilization based on broader macroeconomic policy objectives.
3. Why do petrol and diesel prices vary so significantly across Indian states?
Fuel prices differ because retail rates are subject to varying State-Level Value Added Tax (VAT), local municipal levies, inland freight transportation expenses from oil refineries, and regional dealer commissions.
4. How can retail investors track daily commodity rates safely?
Investors can track benchmark bullion rates via major multi-commodity exchange updates (such as MCX data feeds) and verified financial reporting platforms; ensuring they factor in local jeweler making charges, storage fees, and 3% GST for physical purchases.
Source & Price Verification – Financial Markets
- Gold & Silver Prices: Data referenced from IBJA, MCX India, and international benchmarks.
- Petrol & Diesel Rates: Daily retail prices sourced from Indian Oil, HPCL, and BPCL.
- Commodity Market Data: Verified using MCX, NCDEX, and government statistical releases.
- Verification Process: Prices are cross-checked with at least two independent official or exchange-based sources before publication.
- Disclaimer: Market prices are indicative and may vary by city, tax structure, or intraday volatility.
Note: Prices are updated daily and cross-checked before publishing. If you notice any discrepancy, please email us at [email protected].
